A diary/report detailing our preparation and fieldwork centred around the River Pont and river flooding
This report records the preparation and execution of our geography fieldwork on the question: ‘How vulnerable is Ponteland to the risk of flooding?’ This includes a detailed preparation lesson, a special assembly by members of the Environmental Agency and a fun, active trip around the local area.
Monday 4 July
On this day, myself and my peers attended the lesson preparing us for the fieldwork. Our starter task to set us off was a bit of retrieval practice from one of our earlier topics – river floods. We were tasked with naming various causes of river flooding in two categories: Physical (Natural) and Human (Man-made).
Some physical factors include; high rainfall, low river banks and steep slopes, while some human factors are deforestation, dam breaches and urbanisation. After this task, we were given a sheet with a flood model of Ponteland and the surrounding area. This showed how likely it is that areas on the map will flood, and showed where flood defences are in place.
Five points were scattered across the map, and we were tasked with describing how much at risk of flooding two of the points were. In the bottom right of the sheet were two graphs, one showing the River Pont’s water level across 1 week, and the other across 9 years. We then had to describe the overall risk of flooding using data from said graphs. Finally, we completed a short survey about the Newcastle Quayside, rating it using factors that would cause floods with 1 being the best and 5 the worst for each factor.
Wednesday 6 July
On Wednesday, all students in Year 7 attended an assembly in the hall to do with the trip. The assembly was presented by members of the Environmental Agency. They discussed with us first what a flood actually was: an overflow of a large amount of water beyond its normal limits, especially over what is normally dry land. Next, they went through Ponteland’s flooding history, and how the River Pont’s flooding events have been recorded since the 1800s, with particularly dramatic events occurring in 1900 and 1903. Possibly the worst recorded event was in 2015, where the village experienced horrendous floods following storm Desmond. After that, they explained what flood defences are actually in place around Ponteland, for example, the flood wall, which began construction in September 2020.
Thursday 7 July
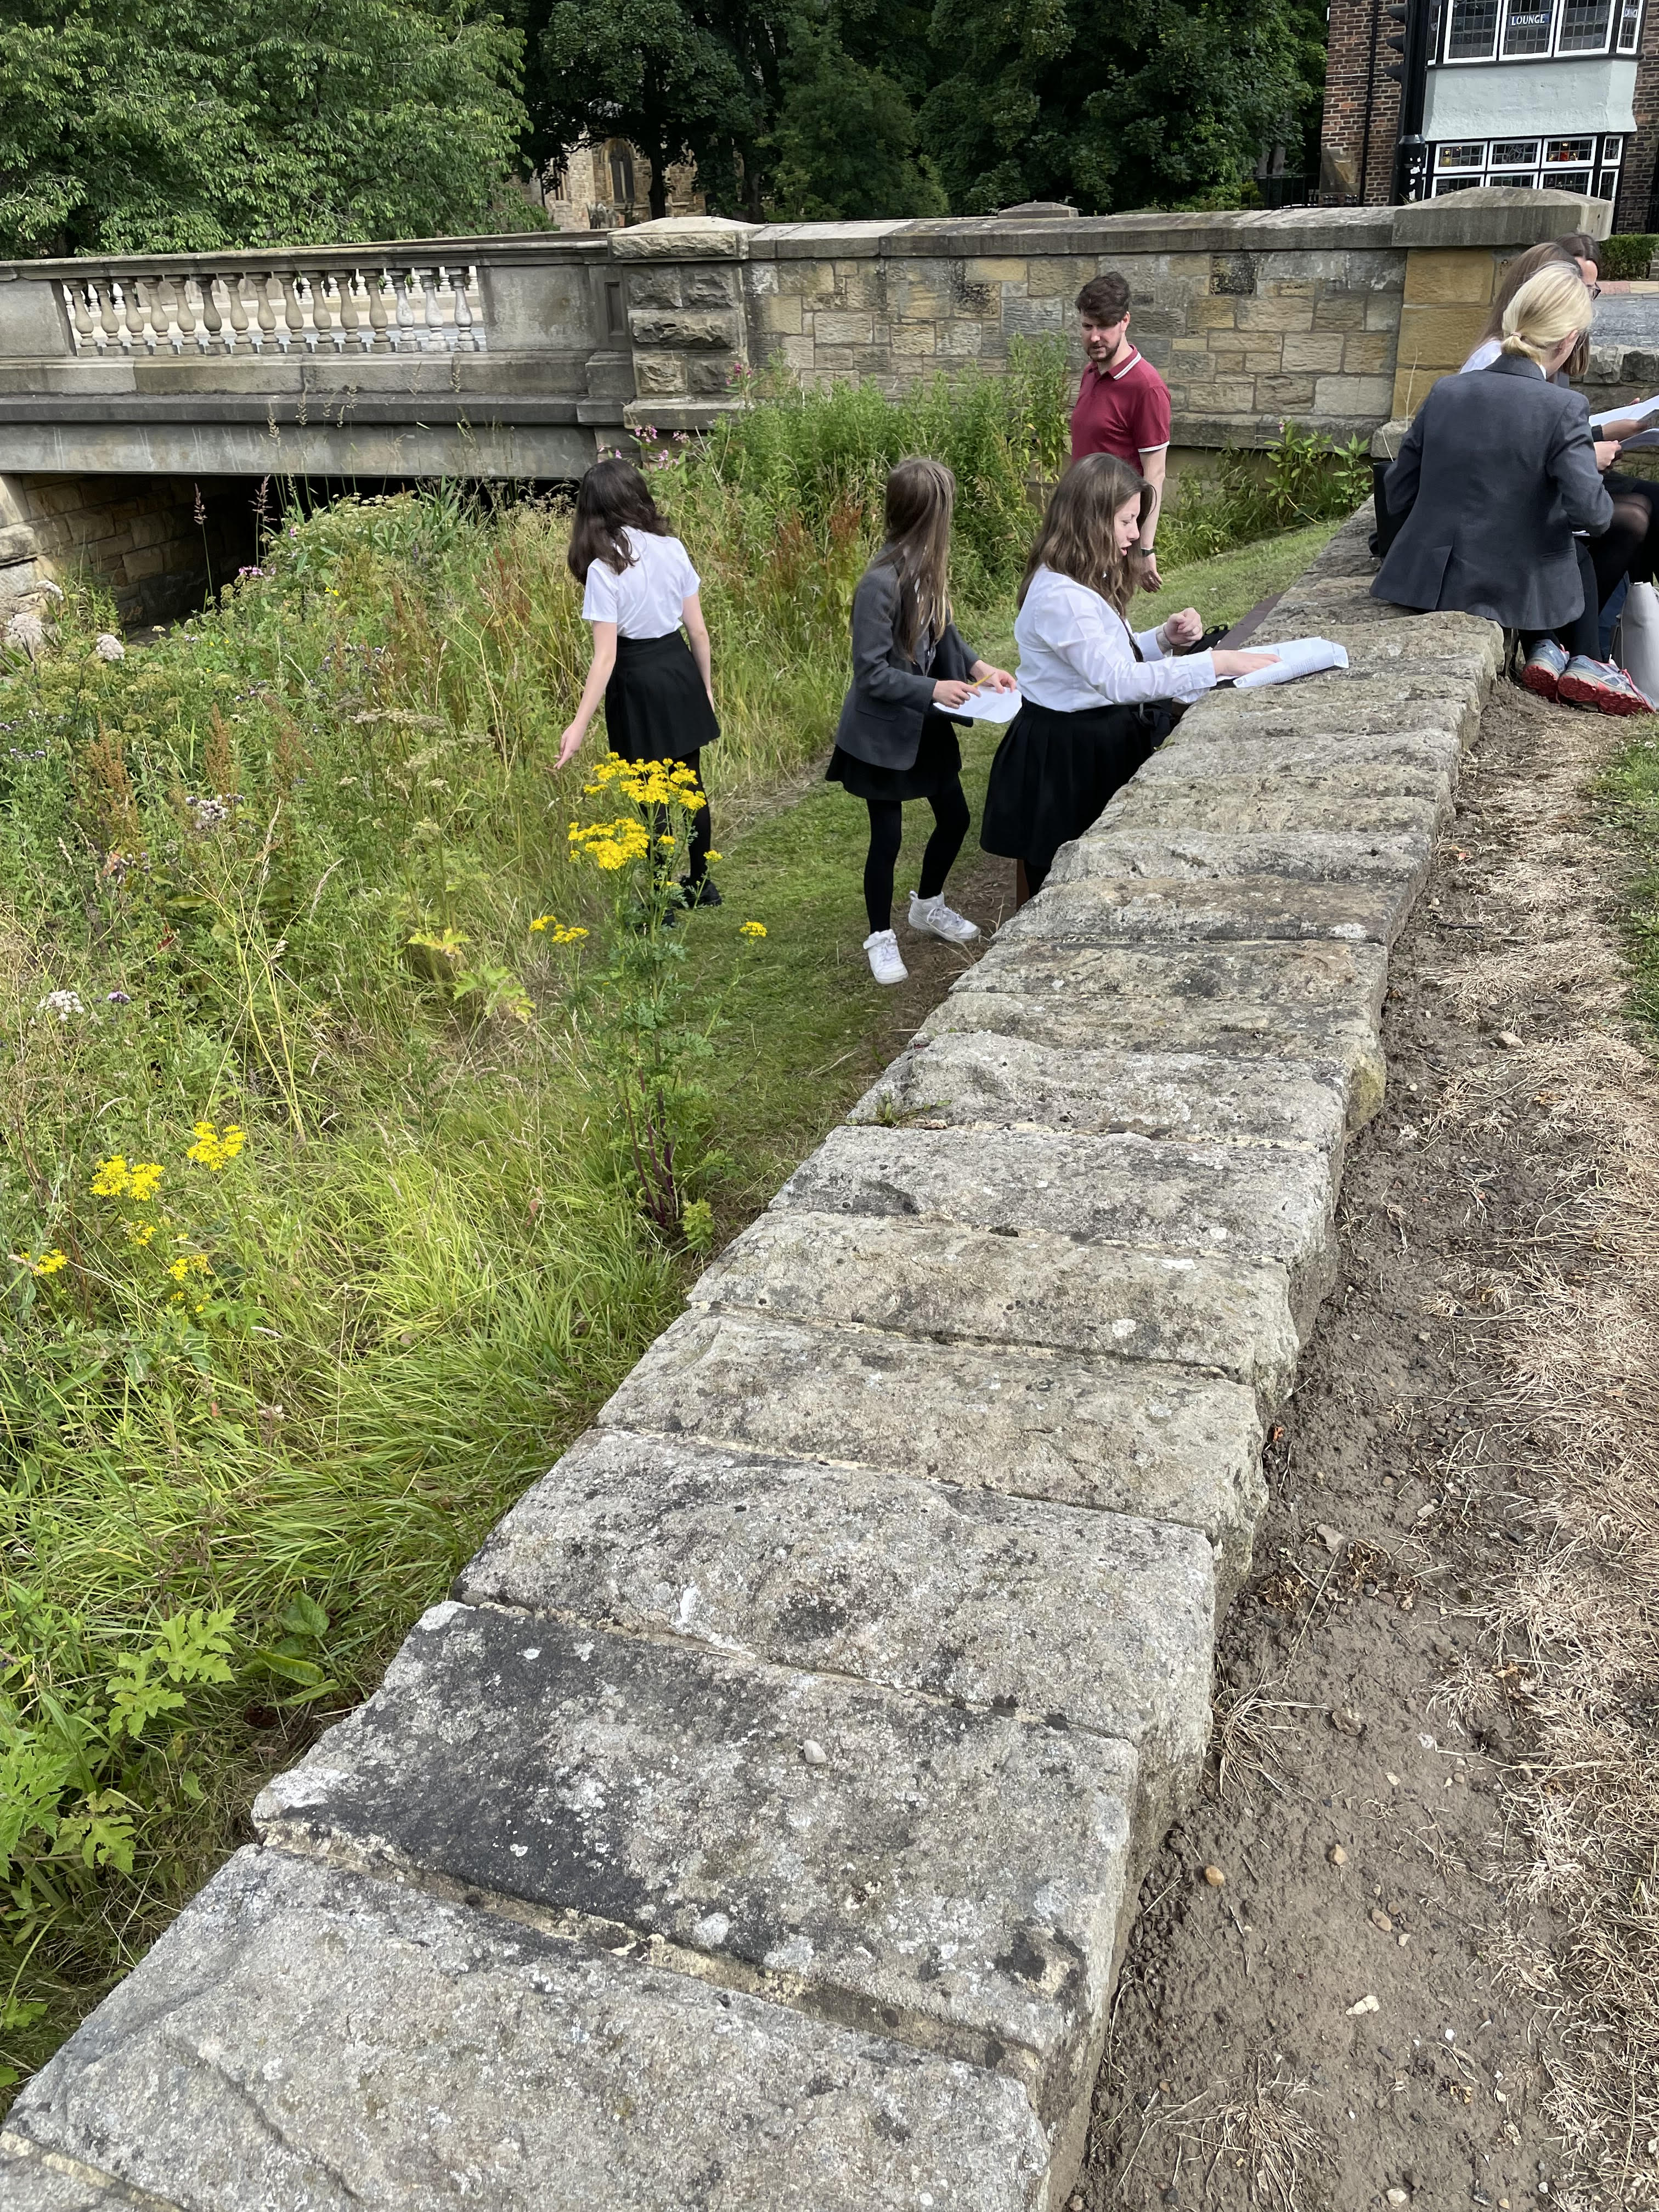
This was the day of our actual fieldwork. We walked around Ponteland, stopping at five different points to mark them against the previously mentioned survey. We did this to find out the risk of flooding at each point out of 30; 30 meaning that the area has an extremely high risk of flooding.
We also did a quick but detailed sketch of three of the locations, labelling anything that could increase or decrease the risk of flooding. For half of the classes in the year group, this trip took place between 9:15 AM and 11:15 AM, and for the rest of the classes, it took place from 11:35 AM to 1:35 PM.


